快速入门指南
本指南帮助您快速上手 ADCToolbox。
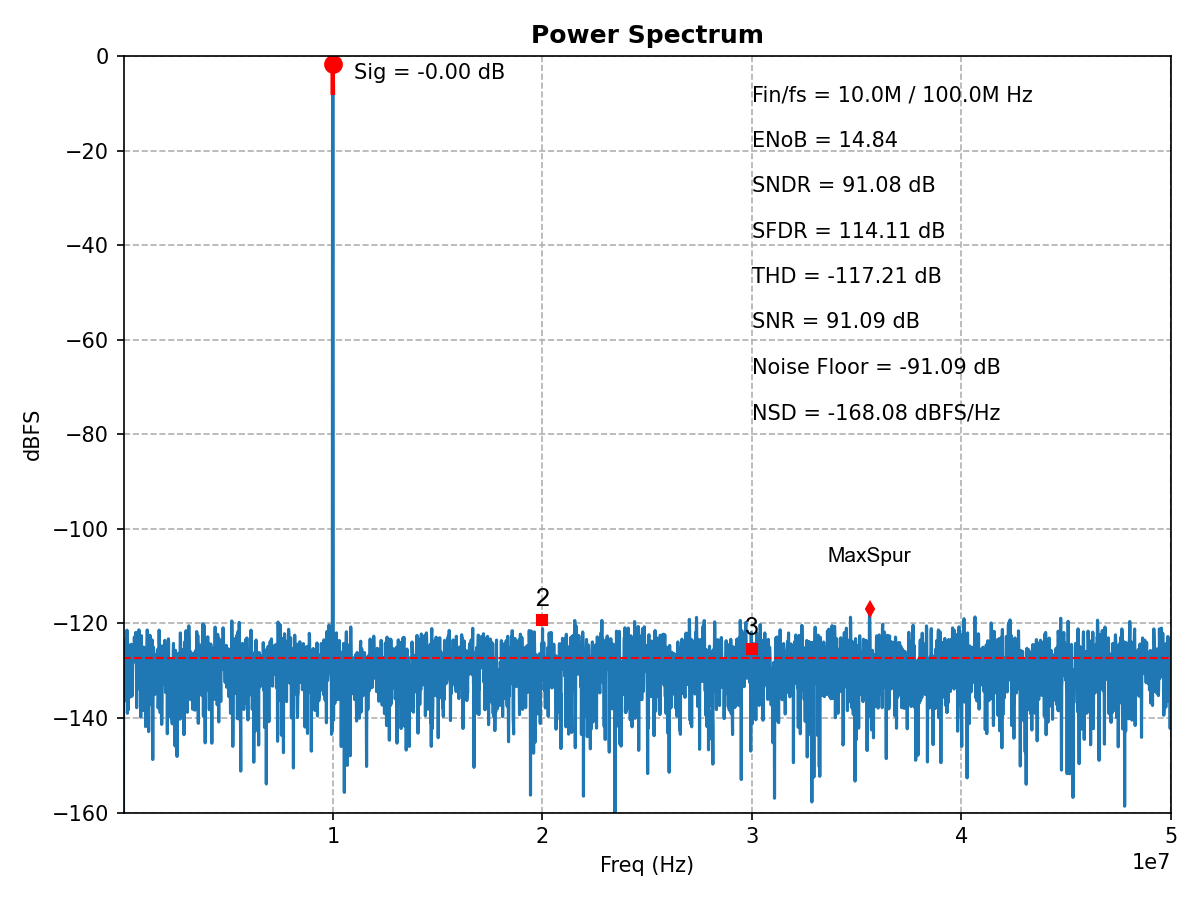
频谱分析
分析 ADC 输出频谱:
import numpy as np
import matplotlib.pyplot as plt
from adctoolbox import analyze_spectrum, find_coherent_frequency

# Generate test signal
N = 2**13              # FFT points (8192 samples)
Fs = 100e6             # Sampling frequency: 100 MHz
Fin_target = 10e6      # Input frequency target: 10 MHz
Fin, _ = find_coherent_frequency(fs=Fs, fin_target=Fin_target, n_fft=N)

t = np.arange(N) / Fs
A = 0.5                # Signal amplitude
DC = 0.5               # DC offset
noise_rms = 10e-6      # Noise RMS: 10 uVrms
signal = A * np.sin(2*np.pi*Fin*t) + DC + np.random.randn(N) * noise_rms

# Analyze spectrum
plt.figure(figsize=(8, 6))
result = analyze_spectrum(signal, fs=Fs)

# Access metrics
print(f"ENOB: {result['enob']:.2f} bits")
print(f"SNDR: {result['sndr_db']:.2f} dB")
print(f"SFDR: {result['sfdr_db']:.2f} dB")
print(f"SNR: {result['snr_db']:.2f} dB")

# Show the interactive plot
plt.show()
预期输出::
ENOB: 14.83 bits
SNDR: 91.06 dB
SFDR: 113.95 dB
SNR: 91.09 dB
使用工具集
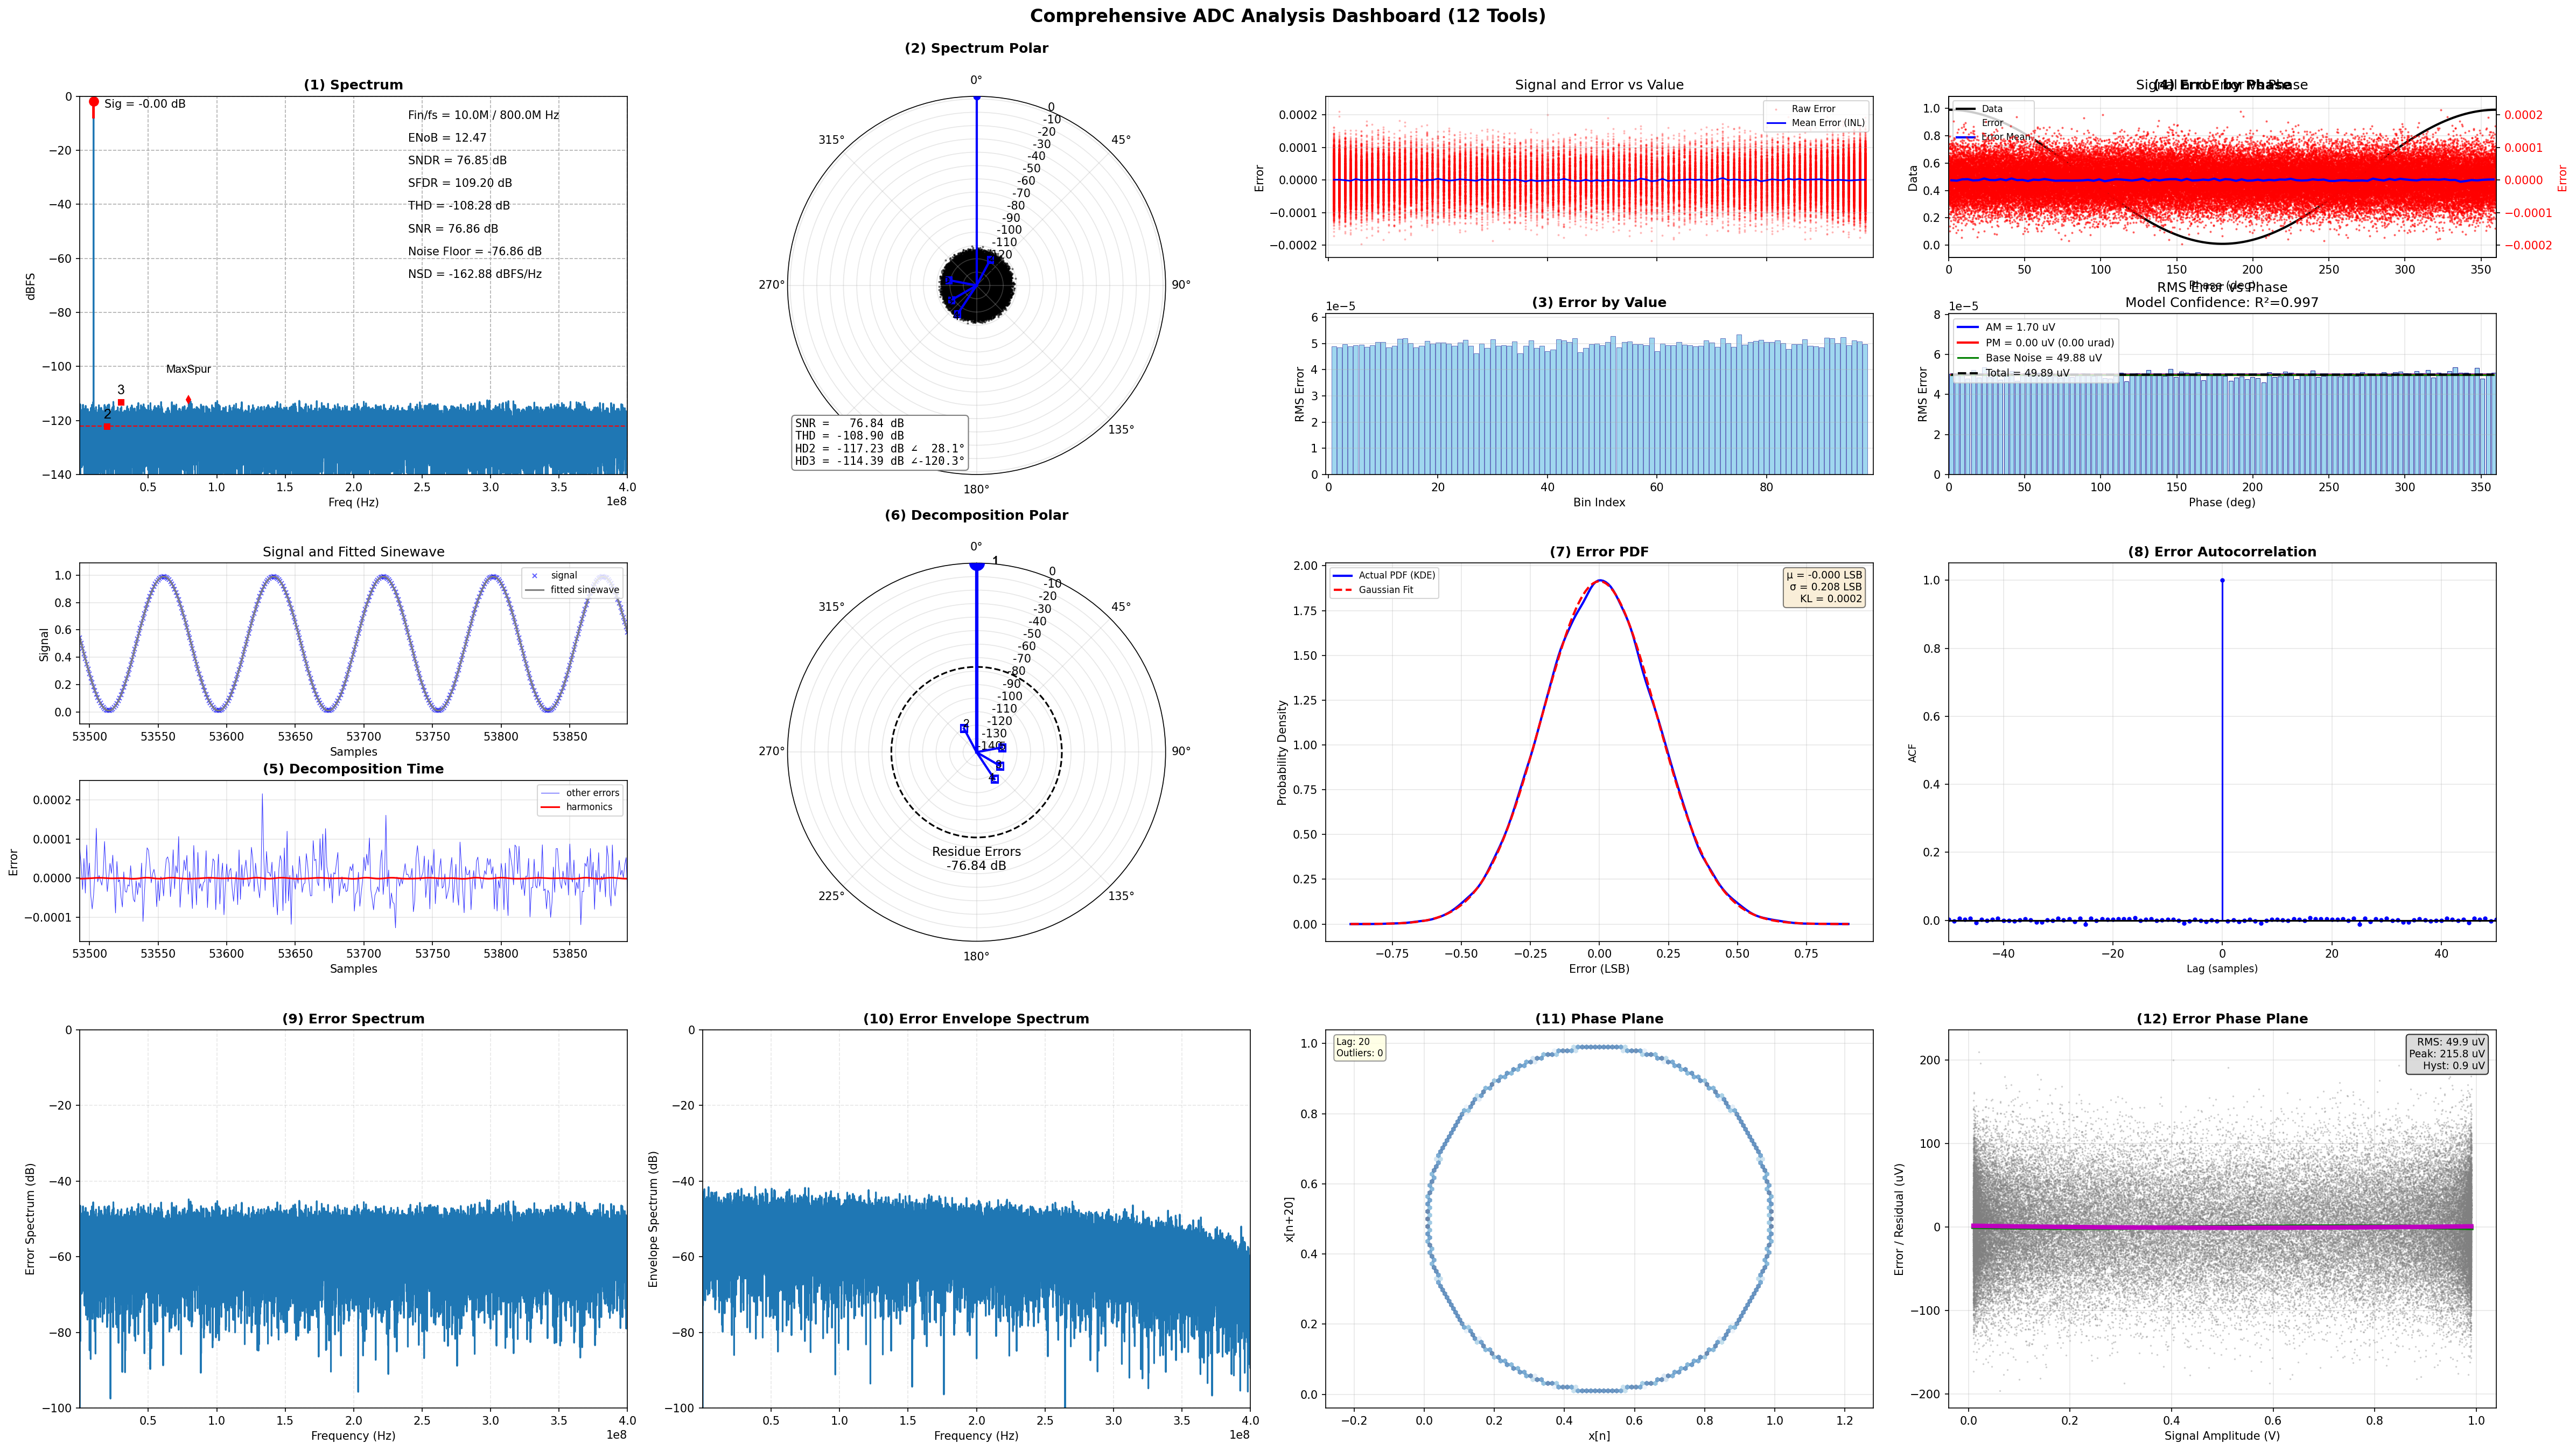
模拟输出仪表盘
为模拟 ADC 输出生成包含 12 个面板的综合诊断仪表盘:
import numpy as np
from adctoolbox.toolset import generate_aout_dashboard
from adctoolbox import find_coherent_frequency

# Generate test signal
N = 2**16              # FFT points (65536 samples)
Fs = 800e6             # Sampling frequency: 800 MHz
Fin_target = 10e6      # Input frequency target: 10 MHz
Fin, _ = find_coherent_frequency(fs=Fs, fin_target=Fin_target, n_fft=N)

t = np.arange(N) / Fs
A = 0.49               # Signal amplitude
DC = 0.5               # DC offset
noise_rms = 50e-6      # Noise RMS: 50 uVrms
resolution = 12        # ADC resolution: 12 bits
signal = A * np.sin(2*np.pi*Fin*t) + DC + np.random.randn(N) * noise_rms

# Generate dashboard with 12 analysis plots
fig, axes = generate_aout_dashboard(
    signal=signal,
    fs=Fs,
    freq=Fin,
    resolution=resolution,
    output_path='aout_dashboard.png'
)
生成一个 3×4 面板仪表盘,包含 12 个诊断图,涵盖频谱分析、误差表征(概率密度函数、自相关、频谱)、极坐标图和相平面分析。
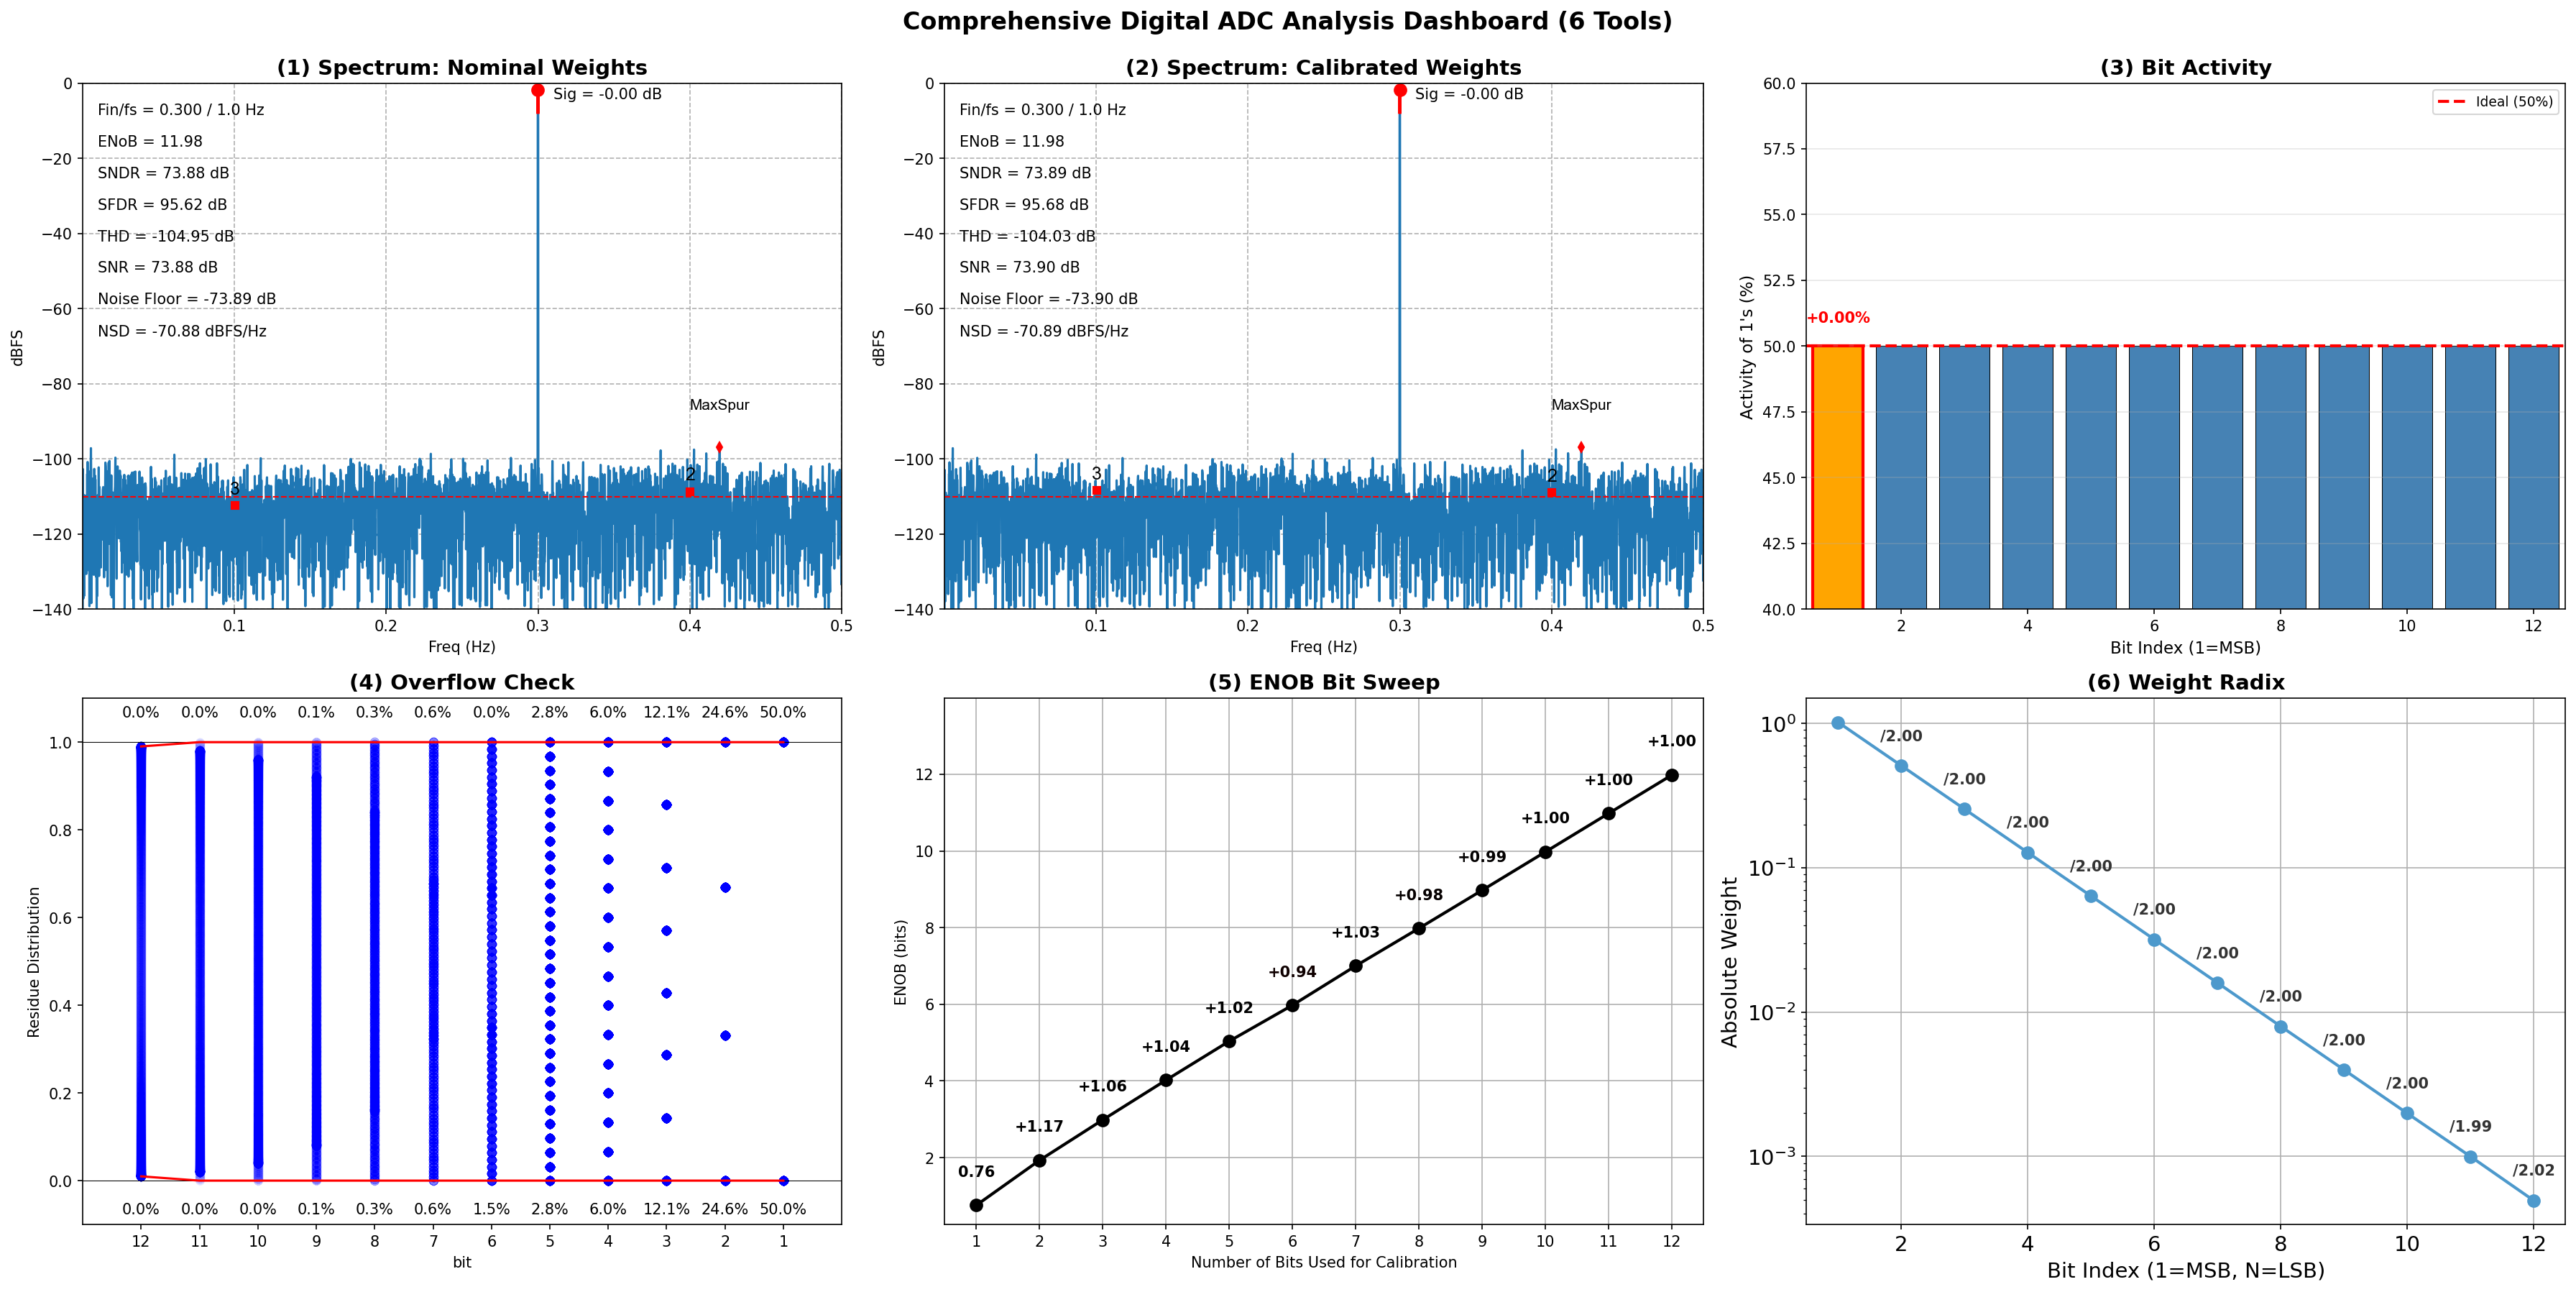
数字输出仪表盘
为数字 ADC 位生成包含 6 个面板的综合诊断仪表盘:
import numpy as np
from adctoolbox.toolset import generate_dout_dashboard
from adctoolbox import find_coherent_frequency

# Generate test signal
N = 2**13              # FFT points (8192 samples)
Fs = 1e9               # Sampling frequency: 1 GHz
Fin_target = 300e6     # Input frequency target: 300 MHz
Fin, _ = find_coherent_frequency(fs=Fs, fin_target=Fin_target, n_fft=N)

t = np.arange(N) / Fs
A = 0.49               # Signal amplitude
DC = 0.5               # DC offset
resolution = 12        # ADC resolution: 12 bits

# Generate quantized signal and extract bits
signal = A * np.sin(2*np.pi*Fin*t) + DC
quantized_signal = np.clip(np.floor(signal * (2**resolution)), 0, 2**resolution - 1).astype(int)
bits = (quantized_signal[:, None] >> np.arange(resolution - 1, -1, -1)) & 1

# Generate dashboard with 6 analysis plots
fig, axes = generate_dout_dashboard(
    bits=bits,
    freq=Fin/Fs,       # Normalized frequency
    weights=None,      # Use binary weights by default
    output_path='dout_dashboard.png'
)
生成一个 2×3 面板仪表盘,包含 6 个诊断图,涵盖校准前后频谱、位活动、溢出检测、ENOB 扫描和位权重基数可视化。
探索更多示例
学习 ADCToolbox 的最佳方式是运行即用示例。
一条命令下载所有示例:
mkdir adc_workspace # Prepare a workspace directory
cd adc_workspace    # Move into the workspace

adctoolbox-get-examples
运行您的第一个示例:
python adctoolbox_examples/01_basic/exp_b01_environment_check.py

python adctoolbox_examples/02_spectrum/exp_s01_analyze_spectrum_simplest.py

python adctoolbox_examples/02_spectrum/exp_s02_analyze_spectrum_interactive.py
所有输出保存到各类别的 output/ 目录中。
详细说明和预期输出请参阅 Examples。